Forward OpenShift logs to Azure Monitor with ClusterLogForwarder and OpenTelemetry
Heads-up: The cleanest path to keep sending OpenShift logs to Azure with the new (non-deprecated) ingestion APIs is to upgrade OpenShift Logging to 6.6, where the ClusterLogForwarder handles this natively. If for some reason you can’t upgrade to 6.6 yet, this post documents a configuration I put together to forward logs to Azure Log Analytics through the current Azure APIs anyway. Just keep in mind that the standalone OpenTelemetry Collector at the center of it is an upstream component, outside of Red Hat support — so treat this as a lab / interim approach rather than a supported production design. The OTLP output of the ClusterLogForwarder is also a Technology Preview feature.
The collector deployment below already has the basics of availability — 2 replicas, spread across nodes with pod anti-affinity, and health probes — but it is still not a fully hardened production design. In particular it has no persistent buffering (logs in flight are kept in memory, so a pod crash can drop them), no TLS on the in-cluster OTLP hop, and no autoscaling or PodDisruptionBudget. See the closing notes for how you’d harden each of these.
In this post I’ll show how to forward OpenShift container logs to Azure Monitor / Log Analytics. The logs flow through an in-cluster OpenTelemetry Collector and land in an Azure Log Analytics workspace, where you can query them with KQL.
I ran every step below against a real OpenShift 4.18 lab cluster running on Azure, with the Red Hat OpenShift Logging operator installed.
Why this matters: the Azure Data Collector API retirement
If you forward OpenShift logs to Azure today, it’s worth knowing what’s changing under the hood.
The OpenShift ClusterLogForwarder has long shipped a native azureMonitor output. Up to and including OpenShift Logging 6.5, that output writes to Azure through the legacy Azure Monitor HTTP Data Collector API — and Microsoft is retiring that API. From the official migration guide:
Support for the legacy Data Collector API ends September 14, 2026. Existing ingestion continues to work, but the API only receives critical security fixes. Migrate to the Logs ingestion API […]
— Migrate from the HTTP Data Collector API to the Logs Ingestion API
In short: pipelines built on the deprecated API keep working for now but are on borrowed time, and clients that don’t negotiate TLS 1.2+ already stopped ingesting on March 1, 2026.
OpenShift Logging 6.6 is the release where the ClusterLogForwarder moves onto the non-deprecated Azure ingestion path, so it keeps sending logs after the September 2026 retirement. If you’re on 6.5 or earlier, you need an approach that doesn’t depend on the old Data Collector API.
That’s exactly what this post builds: instead of relying on the version-dependent native output, the CLF forwards logs over OTLP to an OpenTelemetry Collector, whose azuremonitor exporter ingests into a workspace-based Application Insights resource using the current, supported ingestion path. This works regardless of your OpenShift Logging version and keeps you off the retiring API.
Architecture
The ClusterLogForwarder (CLF) ships logs over OTLP to a standalone OpenTelemetry Collector Deployment, which uses the azuremonitor exporter to push them to a workspace-based Application Insights resource. Because Application Insights is workspace-based, the data is stored in — and queryable from — the linked Log Analytics workspace.
+-------------------+      OTLP/HTTP        +----------------------------+      azuremonitor       +-----------------------+
| ClusterLogForwarder|  --------------->     | OpenTelemetry Collector    |  ------------------->    | Application Insights  |
| (Vector DaemonSet) |  :4318 /v1/logs       | (Deployment, contrib image)|     exporter            | (workspace-based)     |
+-------------------+                        +----------------------------+                         +-----------+-----------+
        ^                                                                                                       |
        |  application + infrastructure logs                                                                    v
+-------------------+                                                                            +-----------------------------+
| OpenShift nodes   |                                                                            | Azure Log Analytics workspace|
+-------------------+                                                                            |  (KQL: AppTraces)            |
                                                                                                 +-----------------------------+
Prerequisites
- The
ocCLI installed locally (I usedoc4.22). - An OpenShift cluster installed on Azure with IPI (so the cluster holds an Azure service principal we can reuse). The lab here was OpenShift 4.18.
- The Red Hat OpenShift Logging operator installed, providing the
observability.openshift.io/v1ClusterLogForwarderAPI. cluster-adminrights (kube:adminis fine for a lab).python3with thevenvmodule, to install the Azure CLI locally.
Log in to the cluster (the lab API endpoint and token are redacted here):
$ oc login --token=sha256~<redacted-token> \
    --server=https://api.<your-cluster>.example.com:6443 \
    --insecure-skip-tls-verify=true
$ oc whoami
kube:admin
NOTE:
--insecure-skip-tls-verify=trueis only needed if the API server uses a certificate signed by an unknown authority, which is common in ephemeral lab clusters. Drop it on a properly trusted cluster.
Confirm the logging stack is present:
$ oc get crd clusterlogforwarders.observability.openshift.io -o name
customresourcedefinition.apps/clusterlogforwarders.observability.openshift.io

$ oc get csv -n openshift-logging | grep -i logging
cluster-logging.v6.4.5   Red Hat OpenShift Logging   6.4.5   ...   Succeeded

$ oc get clusterrole collect-application-logs collect-infrastructure-logs
NAME                          CREATED AT
collect-application-logs      ...
collect-infrastructure-logs   ...
Step 1 — Derive the Azure service principal from the cluster
When OpenShift is installed on Azure with the IPI installer, the installer stores the Azure service principal credentials in a secret in the kube-system namespace. We can reuse that exact identity to talk to Azure, so there are no credentials to type or store in files.
Inspect the secret keys:
$ oc get secret azure-credentials -n kube-system -o jsonpath='{.data}' | \
    python3 -c "import sys,json; print(list(json.load(sys.stdin).keys()))"
['azure_client_id', 'azure_client_secret', 'azure_region', 'azure_resource_prefix', 'azure_resourcegroup', 'azure_subscription_id', 'azure_tenant_id']
Decode the fields into environment variables. I write them to a file outside the git repo (/tmp/azenv) and source it, so the secret never ends up in tracked files:
$ oc get secret azure-credentials -n kube-system -o json | python3 -c "
import sys, json, base64
d = json.load(sys.stdin)['data']
v = lambda k: base64.b64decode(d[k]).decode()
with open('/tmp/azenv', 'w') as f:
    f.write('export AZURE_CLIENT_ID=%s\n'       % v('azure_client_id'))
    f.write('export AZURE_CLIENT_SECRET=%s\n'   % v('azure_client_secret'))
    f.write('export AZURE_TENANT_ID=%s\n'       % v('azure_tenant_id'))
    f.write('export AZURE_SUBSCRIPTION_ID=%s\n' % v('azure_subscription_id'))
    f.write('export AZURE_RESOURCEGROUP=%s\n'   % v('azure_resourcegroup'))
    f.write('export AZURE_REGION=%s\n'          % v('azure_region'))
"
$ chmod 600 /tmp/azenv
A quick (masked) sanity check of what we extracted:
$ source /tmp/azenv
$ echo "client_id=${AZURE_CLIENT_ID:0:8}...  rg=$AZURE_RESOURCEGROUP  region=$AZURE_REGION"
client_id=<redacted>...  rg=<RESOURCE_GROUP>  region=<region>
NOTE: The service principal created by the installer already owns the cluster’s resource group, so it has enough rights to create a Log Analytics workspace and an Application Insights component inside it. We deliberately reuse the cluster’s own resource group.
Step 2 — Install the Azure CLI in a Python virtualenv
The az CLI is not always available on a workstation, and you may not want to install it system-wide. For this walkthrough I used a self-contained Python virtualenv inside the project directory, which keeps everything isolated and easy to throw away. It’s not the only option, though — if you prefer, you can install the Azure CLI as a native binary/package for your platform (the official packages for Linux, macOS, and Windows are described in the Azure CLI install guide). Either way the az commands in the rest of this post are identical; just skip the venv activation if you went the binary route.
$ cd CLFAzure
$ python3 -m venv venv
$ source venv/bin/activate
(venv) $ pip install --upgrade pip
(venv) $ pip install azure-cli
Verify the install:
(venv) $ az version
{
  "azure-cli": "2.87.0",
  ...
}
NOTE: Remember to add
venv/to your.gitignore— you don’t want to commit a few hundred MB of dependencies. To leave the environment later, just rundeactivate.
Now log in to Azure with the service principal we extracted from the cluster:
(venv) $ source /tmp/azenv
(venv) $ az login --service-principal \
    -u "$AZURE_CLIENT_ID" \
    -p "$AZURE_CLIENT_SECRET" \
    --tenant "$AZURE_TENANT_ID"
(venv) $ az account set --subscription "$AZURE_SUBSCRIPTION_ID"
(venv) $ az account show --query "{name:name, id:id}" -o json
{
  "id": "<SUBSCRIPTION_ID>",
  "name": "<subscription-name>"
}
Step 3 — Create the Azure Monitor backend
We need two Azure resources:
- a Log Analytics workspace — the actual log store, and
- a workspace-based Application Insights component — the ingestion endpoint the OpenTelemetry
azuremonitorexporter talks to.
Create the Log Analytics workspace (reusing the cluster’s resource group and region):
(venv) $ az monitor log-analytics workspace create \
    --resource-group "$AZURE_RESOURCEGROUP" \
    --workspace-name law-ocp-lab \
    --location "$AZURE_REGION" \
    --sku PerGB2018 \
    --retention-time 30 \
    --query "{name:name, provisioningState:provisioningState}" -o json
{
  "name": "law-ocp-lab",
  "provisioningState": "Succeeded"
}
Grab its resource ID and create an Application Insights component linked to it (--workspace), which makes it workspace-based (ingestionMode: LogAnalytics):
(venv) $ az config set extension.use_dynamic_install=yes_without_prompt

(venv) $ LAW_ID=$(az monitor log-analytics workspace show \
    --resource-group "$AZURE_RESOURCEGROUP" \
    --workspace-name law-ocp-lab \
    --query id -o tsv)

(venv) $ az monitor app-insights component create \
    --app appi-ocp-lab \
    --resource-group "$AZURE_RESOURCEGROUP" \
    --location "$AZURE_REGION" \
    --kind web \
    --application-type web \
    --workspace "$LAW_ID" \
    --query "{name:name, ingestionMode:ingestionMode}" -o json
{
  "name": "appi-ocp-lab",
  "ingestionMode": "LogAnalytics"
}
Finally, retrieve the connection string. This is the only Azure value the collector needs:
(venv) $ CONNECTION_STRING=$(az monitor app-insights component show \
    --app appi-ocp-lab \
    --resource-group "$AZURE_RESOURCEGROUP" \
    --query connectionString -o tsv)

(venv) $ echo "$CONNECTION_STRING"
InstrumentationKey=<redacted-guid>;IngestionEndpoint=https://<region>.in.applicationinsights.azure.com/;LiveEndpoint=https://<region>.livediagnostics.monitor.azure.com/;ApplicationId=<redacted-guid>
NOTE: If the
az monitor app-insights component createstep prints a warning about acdnmodule deadlock, you can safely ignore it — it’s a harmless Azure CLI module-loader message and the resource is still created (provisioningState: Succeeded).
Step 4 — Pick the latest OpenTelemetry Collector image
We run the contrib distribution of the collector, because the azuremonitor exporter is only included there. Rather than pinning to whatever version a runbook happens to mention, check the latest release tag:
- Browse the releases page: https://github.com/open-telemetry/opentelemetry-collector-releases/releases/latest
At the time of writing the latest release was v0.154.0, so the image is:
ghcr.io/open-telemetry/opentelemetry-collector-releases/opentelemetry-collector-contrib:0.154.0
Substitute the current tag into the Deployment below.
Step 5 — Create the secret with the connection string
$ oc create secret generic azure-appinsights \
    -n openshift-logging \
    --from-literal=connection-string="$CONNECTION_STRING"
secret/azure-appinsights created
Step 6 — Deploy the OpenTelemetry Collector
The collector receives OTLP logs on ports 4317 (gRPC) and 4318 (HTTP), batches them, and exports to Azure Monitor. A debug exporter is added so we can confirm traffic is flowing by reading the pod logs. We run 2 replicas behind the Service for basic availability and load sharing — the collector keeps no shared state, so OTLP traffic simply balances across the pods. To make those replicas actually fault-tolerant, the Deployment adds pod anti-affinity (preferredDuringSchedulingIgnoredDuringExecution, so the scheduler spreads the two pods onto different nodes when it can, without blocking startup if it can’t) and liveness/readiness probes backed by the collector’s health_check extension.
configmap.yaml:
apiVersion: v1
kind: ConfigMap
metadata:
  name: otel-collector-config
  namespace: openshift-logging
data:
  config.yaml: |
    receivers:
      otlp:
        protocols:
          http:
            endpoint: 0.0.0.0:4318
          grpc:
            endpoint: 0.0.0.0:4317

    processors:
      memory_limiter:
        check_interval: 5s
        limit_mib: 400
        spike_limit_mib: 100
      batch:
        timeout: 10s
        send_batch_size: 1024

    exporters:
      azuremonitor:
        connection_string: "${APPLICATIONINSIGHTS_CONNECTION_STRING}"
        maxbatchsize: 1024
        maxbatchinterval: 10s
      debug:
        verbosity: basic

    extensions:
      health_check:
        endpoint: 0.0.0.0:13133

    service:
      extensions: [health_check]
      pipelines:
        logs:
          receivers: [otlp]
          processors: [memory_limiter, batch]
          exporters: [azuremonitor, debug]
The health_check extension exposes an HTTP endpoint on port 13133 that we wire to the pod’s liveness/readiness probes below, so the Service only sends OTLP traffic to collector pods that are actually ready.
deploy-service.yaml (note the image tag from Step 4 and the connection string injected from the secret):
apiVersion: apps/v1
kind: Deployment
metadata:
  name: otel-collector-contrib
  namespace: openshift-logging
  labels:
    app: otel-collector
spec:
  replicas: 2
  selector:
    matchLabels:
      app: otel-collector
  template:
    metadata:
      labels:
        app: otel-collector
    spec:
      affinity:
        podAntiAffinity:
          preferredDuringSchedulingIgnoredDuringExecution:
            - weight: 100
              podAffinityTerm:
                labelSelector:
                  matchLabels:
                    app: otel-collector
                topologyKey: kubernetes.io/hostname
      containers:
        - name: collector
          image: ghcr.io/open-telemetry/opentelemetry-collector-releases/opentelemetry-collector-contrib:0.154.0
          args: ["--config=/etc/otelcol/config.yaml"]
          ports:
            - containerPort: 4317
              name: otlp-grpc
            - containerPort: 4318
              name: otlp-http
            - containerPort: 13133
              name: health
          env:
            - name: APPLICATIONINSIGHTS_CONNECTION_STRING
              valueFrom:
                secretKeyRef:
                  name: azure-appinsights
                  key: connection-string
          livenessProbe:
            httpGet:
              path: /
              port: 13133
            initialDelaySeconds: 10
            periodSeconds: 15
          readinessProbe:
            httpGet:
              path: /
              port: 13133
            initialDelaySeconds: 5
            periodSeconds: 10
          volumeMounts:
            - name: config
              mountPath: /etc/otelcol
          resources:
            requests:
              cpu: 200m
              memory: 256Mi
            limits:
              cpu: 500m
              memory: 512Mi
      volumes:
        - name: config
          configMap:
            name: otel-collector-config
---
apiVersion: v1
kind: Service
metadata:
  name: otel-collector
  namespace: openshift-logging
  labels:
    app: otel-collector
spec:
  selector:
    app: otel-collector
  ports:
    - name: otlp-http
      port: 4318
      targetPort: 4318
    - name: otlp-grpc
      port: 4317
      targetPort: 4317
Apply both:
$ oc apply -f configmap.yaml
$ oc apply -f deploy-service.yaml
$ oc rollout status deployment/otel-collector-contrib -n openshift-logging
deployment "otel-collector-contrib" successfully rolled out
Step 7 — ServiceAccount and RBAC for the log collector
The CLF collector pods run under a dedicated ServiceAccount that must be allowed to collect logs. We grant application and infrastructure log collection (audit is intentionally left out for this lab).
serviceaccount.yaml:
apiVersion: v1
kind: ServiceAccount
metadata:
  name: logcollector
  namespace: openshift-logging
---
apiVersion: rbac.authorization.k8s.io/v1
kind: ClusterRoleBinding
metadata:
  name: openshift-logging-logcollector-collect-application-logs
roleRef:
  apiGroup: rbac.authorization.k8s.io
  kind: ClusterRole
  name: collect-application-logs
subjects:
  - kind: ServiceAccount
    name: logcollector
    namespace: openshift-logging
---
apiVersion: rbac.authorization.k8s.io/v1
kind: ClusterRoleBinding
metadata:
  name: openshift-logging-logcollector-collect-infrastructure-logs
roleRef:
  apiGroup: rbac.authorization.k8s.io
  kind: ClusterRole
  name: collect-infrastructure-logs
subjects:
  - kind: ServiceAccount
    name: logcollector
    namespace: openshift-logging
$ oc apply -f serviceaccount.yaml
Step 8 — Create the ClusterLogForwarder
This is the heart of the setup. The CLF forwards application and infrastructure logs to a single otlp output pointing at the collector’s in-cluster service.
Two important details:
- The output URL must include the
/v1/logspath. Without it, the collector returns404 Not Foundand nothing is forwarded. - OTLP output is Technology Preview, so the
observability.openshift.io/tech-preview-otlp-output: "enabled"annotation is required.
Beyond the bare minimum, this CLF also carries a few production-friendly options that are worth enabling when you ship logs to Azure. Each is explained right after the manifest.
clf.yaml:
apiVersion: observability.openshift.io/v1
kind: ClusterLogForwarder
metadata:
  name: clf-otlp
  namespace: openshift-logging
  annotations:
    observability.openshift.io/tech-preview-otlp-output: "enabled"
spec:
  serviceAccount:
    name: logcollector
  # Optional: let the Vector collector pods run on tainted nodes too.
  collector:
    tolerations:
      - effect: NoSchedule
        key: node.ocs.openshift.io/storage
        operator: Equal
        value: "true"
  filters:
    - name: multiline-exceptions
      type: detectMultilineException
    - name: cluster-metadata
      type: openshiftLabels
      openshiftLabels:
        cluster_name: ocp-lab.example.com
    - name: prune-for-azure
      type: prune
      prune:
        notIn:
          - .log_type
          - .log_source
          - .message
          - ."@timestamp"
          - .level
          - .hostname
          - .openshift.cluster_id
          - .openshift.labels.cluster_name
          - .kubernetes.namespace_name
          - .kubernetes.pod_name
          - .kubernetes.container_name
          - .kubernetes.labels.app
          - .kubernetes.labels.version
          - .kubernetes.labels.component
  outputs:
    - name: otel-azure
      type: otlp
      otlp:
        url: "http://otel-collector.openshift-logging.svc:4318/v1/logs"
  pipelines:
    - name: all-logs
      inputRefs:
        - application
        - infrastructure
      filterRefs:
        - multiline-exceptions
        - cluster-metadata
        - prune-for-azure
      outputRefs:
        - otel-azure
$ oc apply -f clf.yaml
clusterlogforwarder.observability.openshift.io/clf-otlp created
What the extra pieces do:
detectMultilineException(multiline) — stitches stack traces and other multi-line exceptions back into a single log record instead of one record per line. Without it, a Java/Python traceback arrives in Azure as dozens of disconnected entries.openshiftLabels(cluster-metadata) — stamps a fixedcluster_namelabel onto every record. This is invaluable when several clusters forward into the same Log Analytics workspace: you can filter by cluster in KQL. Replaceocp-lab.example.comwith something that identifies your cluster. In Azure this surfaces in theAppTracesPropertiescolumn asopenshift.label.cluster_name.prune(prune-for-azure) —notInkeeps only the listed fields and drops everything else before the record leaves the cluster. Since Azure Log Analytics bills per ingested GB, pruning is a direct cost and noise reducer. Keep the fields you actually query on (here: the message, level, timestamp, cluster id/name, and the namespace/pod/container/labels you care about). Note that.log_type,.log_sourceand.messageare required and should always be retained.spec.collector.tolerations(tolerations) — these apply to the Vector collector DaemonSet that OpenShift Logging runs (one pod per node), not to the standalone OTel Collector Deployment from Step 6. The example tolerates the OpenShift Data Foundation storage taint (node.ocs.openshift.io/storage) so the collector also runs on ODF/storage nodes and their logs are not missed. This block is optional and cluster-specific — add or change taint keys/values to match your nodes, or drop it entirely if you have no tainted nodes. A toleration with no matching taint is simply ignored, so it’s harmless to leave in.
Step 9 — Deploy a test workload that generates logs
To have predictable, easy-to-find log lines flowing end to end, deploy a tiny workload in its own namespace that prints a timestamped message every 10 seconds in an infinite loop. Because it runs in a regular user namespace, its output is collected as an application log.
log-generator.yaml:
apiVersion: v1
kind: Namespace
metadata:
  name: log-generator
  labels:
    purpose: clf-azure-test
---
apiVersion: apps/v1
kind: Deployment
metadata:
  name: log-generator
  namespace: log-generator
  labels:
    app: log-generator
spec:
  replicas: 1
  selector:
    matchLabels:
      app: log-generator
  template:
    metadata:
      labels:
        app: log-generator
    spec:
      containers:
        - name: log-generator
          image: registry.access.redhat.com/ubi9/ubi-minimal:latest
          command:
            - /bin/sh
            - -c
            - |
              i=0
              while true; do
                i=$((i+1))
                echo "$(date -u +%Y-%m-%dT%H:%M:%SZ) [log-generator] test message #${i} - hello from OpenShift to Azure Monitor"
                sleep 10
              done
          resources:
            requests:
              cpu: 10m
              memory: 16Mi
            limits:
              cpu: 50m
              memory: 32Mi
$ oc apply -f log-generator.yaml
namespace/log-generator created
deployment.apps/log-generator created

$ oc logs deployment/log-generator -n log-generator --tail=3
2026-06-15T13:25:37Z [log-generator] test message #1 - hello from OpenShift to Azure Monitor
2026-06-15T13:25:47Z [log-generator] test message #2 - hello from OpenShift to Azure Monitor
2026-06-15T13:25:57Z [log-generator] test message #3 - hello from OpenShift to Azure Monitor
We’ll search for these log-generator messages in Azure in the last step to prove the whole pipeline works.
Step 10 — Verify the deployment
Check that the CLF reconciled cleanly:
$ oc get clusterlogforwarder clf-otlp -n openshift-logging \
    -o jsonpath='{range .status.conditions[*]}{.type}={.status} ({.reason}){"\n"}{end}'
observability.openshift.io/Authorized=True (ClusterRolesExist)
observability.openshift.io/Valid=True (ValidationSuccess)
Ready=True (ReconciliationComplete)
Once the CLF is created, the operator spins up a Vector collector pod per node (a DaemonSet named after the CLF) plus our 2-replica collector Deployment:
$ oc get pods -n openshift-logging
NAME                                       READY   STATUS    RESTARTS   AGE
clf-otlp-4lqz8                             1/1     Running   0          28s
clf-otlp-4pf4k                             1/1     Running   0          27s
...
otel-collector-contrib-79f7fbc894-hjjqm    1/1     Running   0          41s
otel-collector-contrib-79f7fbc894-k2t8r    1/1     Running   0          41s
Look at the collector logs — the OTLP receivers should be listening and the debug exporter should report log records flowing through:
$ oc logs deployment/otel-collector-contrib -n openshift-logging --tail=20
... otlpreceiver  Starting GRPC server  endpoint [::]:4317
... otlpreceiver  Starting HTTP server  endpoint [::]:4318
... service       Everything is ready. Begin running and processing data.
... Logs  {"otelcol.component.id": "debug", "otelcol.signal": "logs", "log records": 6324}
Make sure there are no 404 errors on the Vector side (this is the symptom of a missing /v1/logs path):
$ oc logs -l app.kubernetes.io/name=vector -n openshift-logging --tail=200 | grep -i 404
# (no output is what you want)
Step 11 — Query the logs in Azure Log Analytics
Logs sent through the azuremonitor exporter land in the AppTraces table of the linked Log Analytics workspace. Give Azure a couple of minutes to ingest, then query it with KQL. You can do this from the Azure Portal (Log Analytics workspace → Logs) or directly from the CLI:
(venv) $ LAW_GUID=$(az monitor log-analytics workspace show \
--resource-group "$AZURE_RESOURCEGROUP" \
--workspace-name law-ocp-lab \
--query customerId -o tsv)
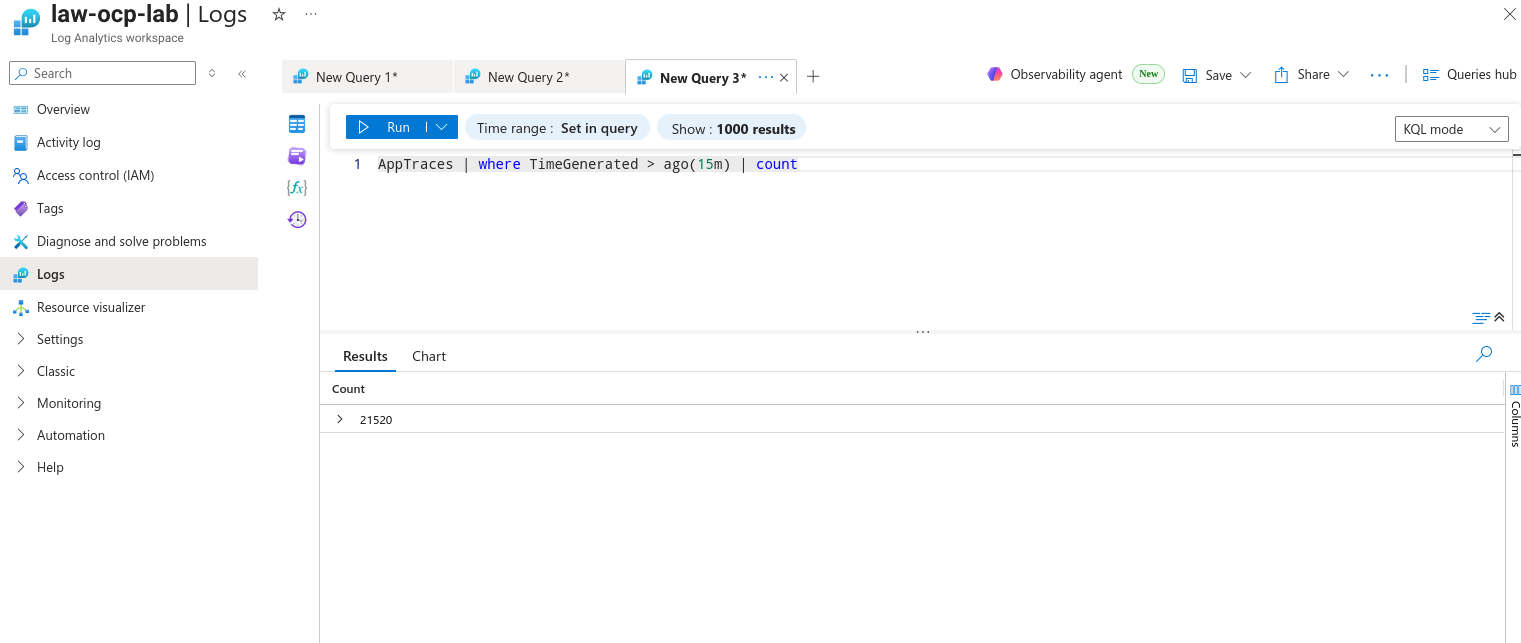
(venv) $ az monitor log-analytics query -w "$LAW_GUID" \
--analytics-query "AppTraces | where TimeGenerated > ago(15m) | count" -o table
Count TableName
------- -------------
3166 PrimaryResult
Now look specifically for the log-generator messages we created in Step 9 — this proves the full path from a user workload all the way to Azure:
(venv) $ az monitor log-analytics query -w "$LAW_GUID" \
    --analytics-query "AppTraces | where TimeGenerated > ago(10m) | where Message has 'log-generator' | project TimeGenerated, Message | order by TimeGenerated desc | take 5" -o table
Message                                                                                        TimeGenerated
---------------------------------------------------------------------------------------------  ----------------------------
2026-06-15T13:27:18Z [log-generator] test message #11 - hello from OpenShift to Azure Monitor  2026-06-15T13:27:18.1310111Z
2026-06-15T13:27:08Z [log-generator] test message #10 - hello from OpenShift to Azure Monitor  2026-06-15T13:27:08.1262870Z
2026-06-15T13:26:58Z [log-generator] test message #9 - hello from OpenShift to Azure Monitor   2026-06-15T13:26:58.1217817Z
2026-06-15T13:26:48Z [log-generator] test message #8 - hello from OpenShift to Azure Monitor   2026-06-15T13:26:48.0353744Z
2026-06-15T13:26:38Z [log-generator] test message #7 - hello from OpenShift to Azure Monitor   2026-06-15T13:26:38.0307652Z
Because we added the cluster-metadata filter, every record also carries the cluster_name label in the Properties column — handy when multiple clusters share one workspace. You can pivot on it directly in KQL:
(venv) $ az monitor log-analytics query -w "$LAW_GUID" \
    --analytics-query "AppTraces | where TimeGenerated > ago(10m) | extend cluster_name = tostring(Properties['openshift.label.cluster_name']) | summarize count() by cluster_name" -o table
Cluster_name          Count_
--------------------  --------
ocp-lab.example.com   1240
The same query in the Azure Portal (Log Analytics workspace → Logs) shows the messages in the results grid:
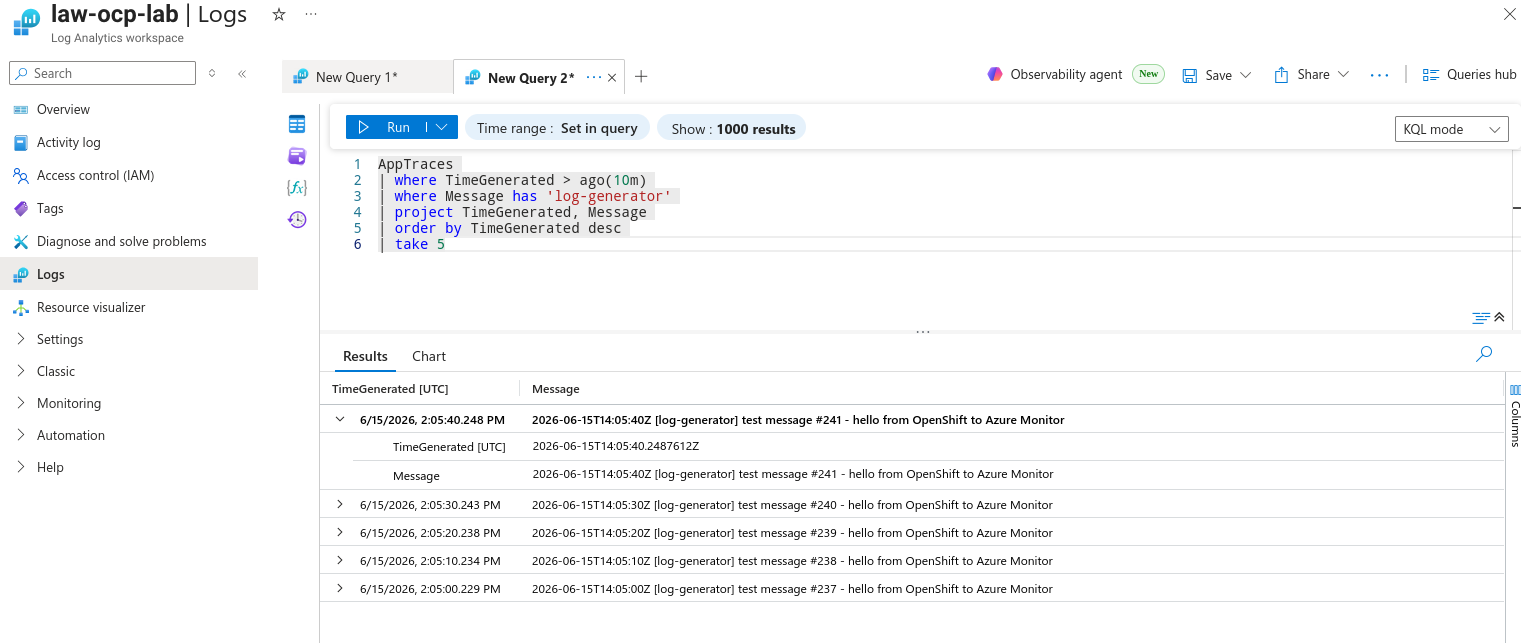
That’s it — OpenShift application and infrastructure logs are now searchable in your Azure Log Analytics workspace.
Cleanup
To tear everything down:
# OpenShift side
$ oc delete -f log-generator.yaml
$ oc delete -f clf.yaml
$ oc delete -f serviceaccount.yaml
$ oc delete -f deploy-service.yaml
$ oc delete -f configmap.yaml
$ oc delete secret azure-appinsights -n openshift-logging
$ oc delete clusterrolebinding \
    openshift-logging-logcollector-collect-application-logs \
    openshift-logging-logcollector-collect-infrastructure-logs

# Azure side (optional, if you created dedicated resources)
(venv) $ az monitor app-insights component delete --app appi-ocp-lab --resource-group "$AZURE_RESOURCEGROUP"
(venv) $ az monitor log-analytics workspace delete --workspace-name law-ocp-lab --resource-group "$AZURE_RESOURCEGROUP" --yes

# Local
(venv) $ deactivate
$ rm -rf venv /tmp/azenv
Closing notes
- The whole pipeline relies on a single Azure value: the Application Insights connection string. Everything else is standard OpenShift logging plumbing.
- Reusing the cluster’s own service principal (from
kube-system/azure-credentials) means you don’t have to create or manage any extra Azure identity for a lab. - This setup already runs 2 replicas with anti-affinity and health probes, but to take it further toward production you would still want to:
- Persistent buffering — add the
file_storageextension plus asending_queueon the exporter, backed by aPersistentVolumeClaim, so logs aren’t lost in memory when a collector pod restarts. - TLS on the OTLP hop — terminate TLS on the collector (and have the CLF output trust it) instead of plain HTTP inside the cluster.
- PodDisruptionBudget — e.g.
minAvailable: 1, so node drains and upgrades never take both replicas down at once. - Autoscaling and sizing — tune the
memory_limiter/batchsettings and consider an HPA for high log volumes. - Cost control — watch Azure ingestion cost (the
PerGB2018SKU bills per ingested GB); theprunefilter from Step 8 is your first line of defense here.
- Persistent buffering — add the