The 4% rule in Europe: a Monte Carlo analysis for FIRE investors
This article summarises the key findings from my bachelor’s degree dissertation in Statistics and Big Data (Universitas Mercatorum, Academic Year 2024/2025). The thesis, titled “Retirement savings management: the 4% rule and the FIRE movement. A European and Italian case study”, investigates whether the famous “4% rule” – widely used in the FIRE (Financial Independence, Retire Early) community – actually works for European investors.
The full thesis is available as a PDF download, and the entire analysis code is open source on GitHub.
The problem: can European investors rely on the 4% rule?
The “4% rule” originates from William Bengen’s 1994 study and the subsequent “Trinity Study” (Cooley, Hubbard, and Walz, 1998). These studies, based on US market data from 1926 to 1995, concluded that a retiree can withdraw 4% of their initial portfolio each year (adjusted for inflation) with a probability exceeding 95% of not running out of money over a 30-year horizon.
The problem is that these studies are based entirely on US market data, which has historically been among the best-performing in the world. European markets have delivered lower returns, faced the sovereign debt crisis (2010–2012), and present a very different bond landscape. Additionally, European investors face specific challenges:
- Lower historical equity returns compared to the US
- Different bond yields (German Bunds vs Italian BTPs vs US Treasuries)
- Higher taxation on financial income in many European countries (e.g. 26% in Italy on equity capital gains, 12.5% on government bonds)
- Different inflation dynamics (Euro area HICP vs US CPI)
So the question is: does the 4% rule still work if you invest in European markets?
Methodology
The study employs Monte Carlo simulations with a block bootstrap technique on historical data from the 2000–2025 period. Unlike traditional Monte Carlo simulations that assume normally distributed returns, block bootstrap:
- Samples consecutive 6-month blocks of historical daily returns
- Preserves the serial autocorrelation of returns
- Maintains the correlation structure between assets
- Does not assume any parametric distribution
The analysis tested 161 distinct scenarios across the following parameters, for a total of 16.1 million simulations:
| Parameter | Values tested |
|---|---|
| Withdrawal Rate | 3.0%, 3.5%, 4.0% |
| Equity allocation | 60%, 70%, 80%, 90%, 100% |
| Equity index | MSCI World, MSCI ACWI, MSCI Europe, MSCI EMU |
| Bond component | German Bund 10Y, Italian BTP 10Y, Bund+BTP Mix |
| Time horizon | 30 years |
| Simulations | 100,000 per scenario |
All equity indices are used in the Net Total Return version denominated in EUR. Inflation is measured using the HICP (Harmonised Index of Consumer Prices) for the euro area.
The entire analysis was implemented in Python 3.12 and containerised with Podman for full reproducibility.
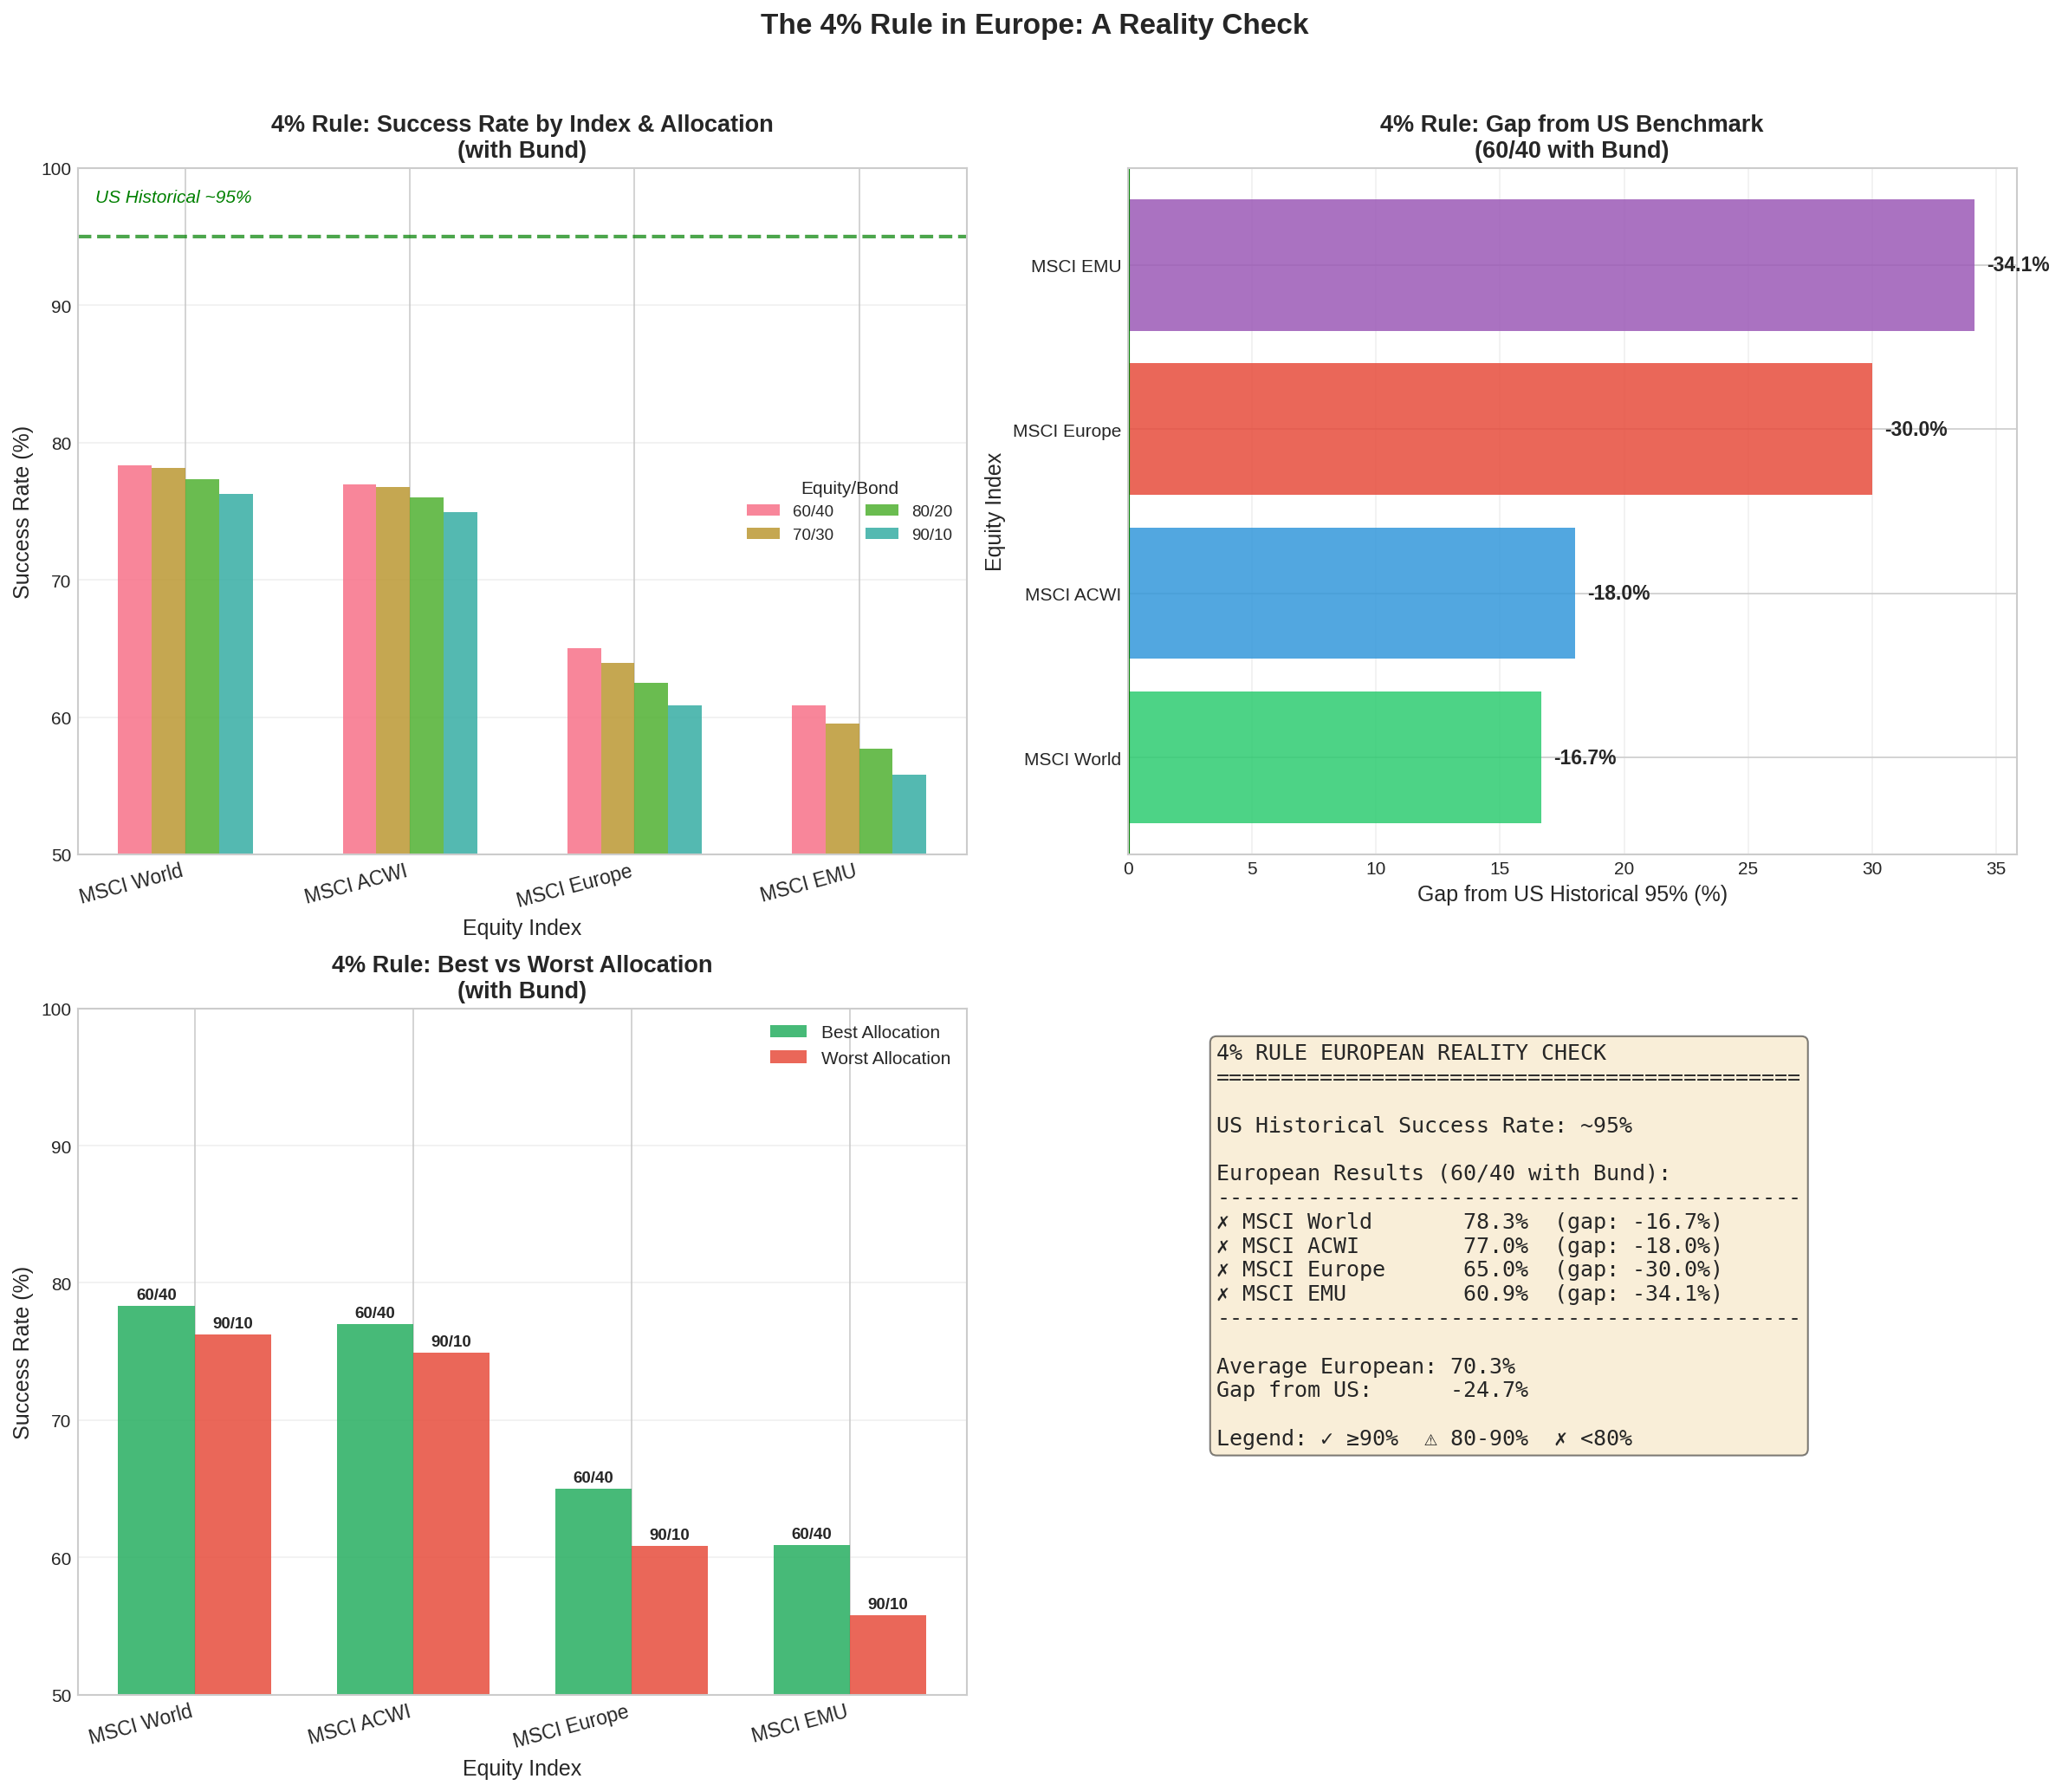
Key finding: the 4% rule does not work in Europe
The most important result is clear: the 4% rule does not reach the 95% safety threshold in any of the European scenarios tested.
The table below shows the success rates at 4% withdrawal rate with a 60/40 allocation:
| Index | Bond | Success Rate | Final Median |
|---|---|---|---|
| MSCI World | BTP | 80.46% | 1,188,838 EUR |
| MSCI World | Bund | 78.35% | 899,494 EUR |
| MSCI ACWI | BTP | 79.18% | 1,113,314 EUR |
| MSCI Europe | Bund | 65.00% | 384,577 EUR |
| MSCI EMU | Bund | 60.88% | 294,456 EUR |
The best result (80.46%) is obtained with MSCI World + BTP, but this is still far from the 95% benchmark that the original US studies achieved.
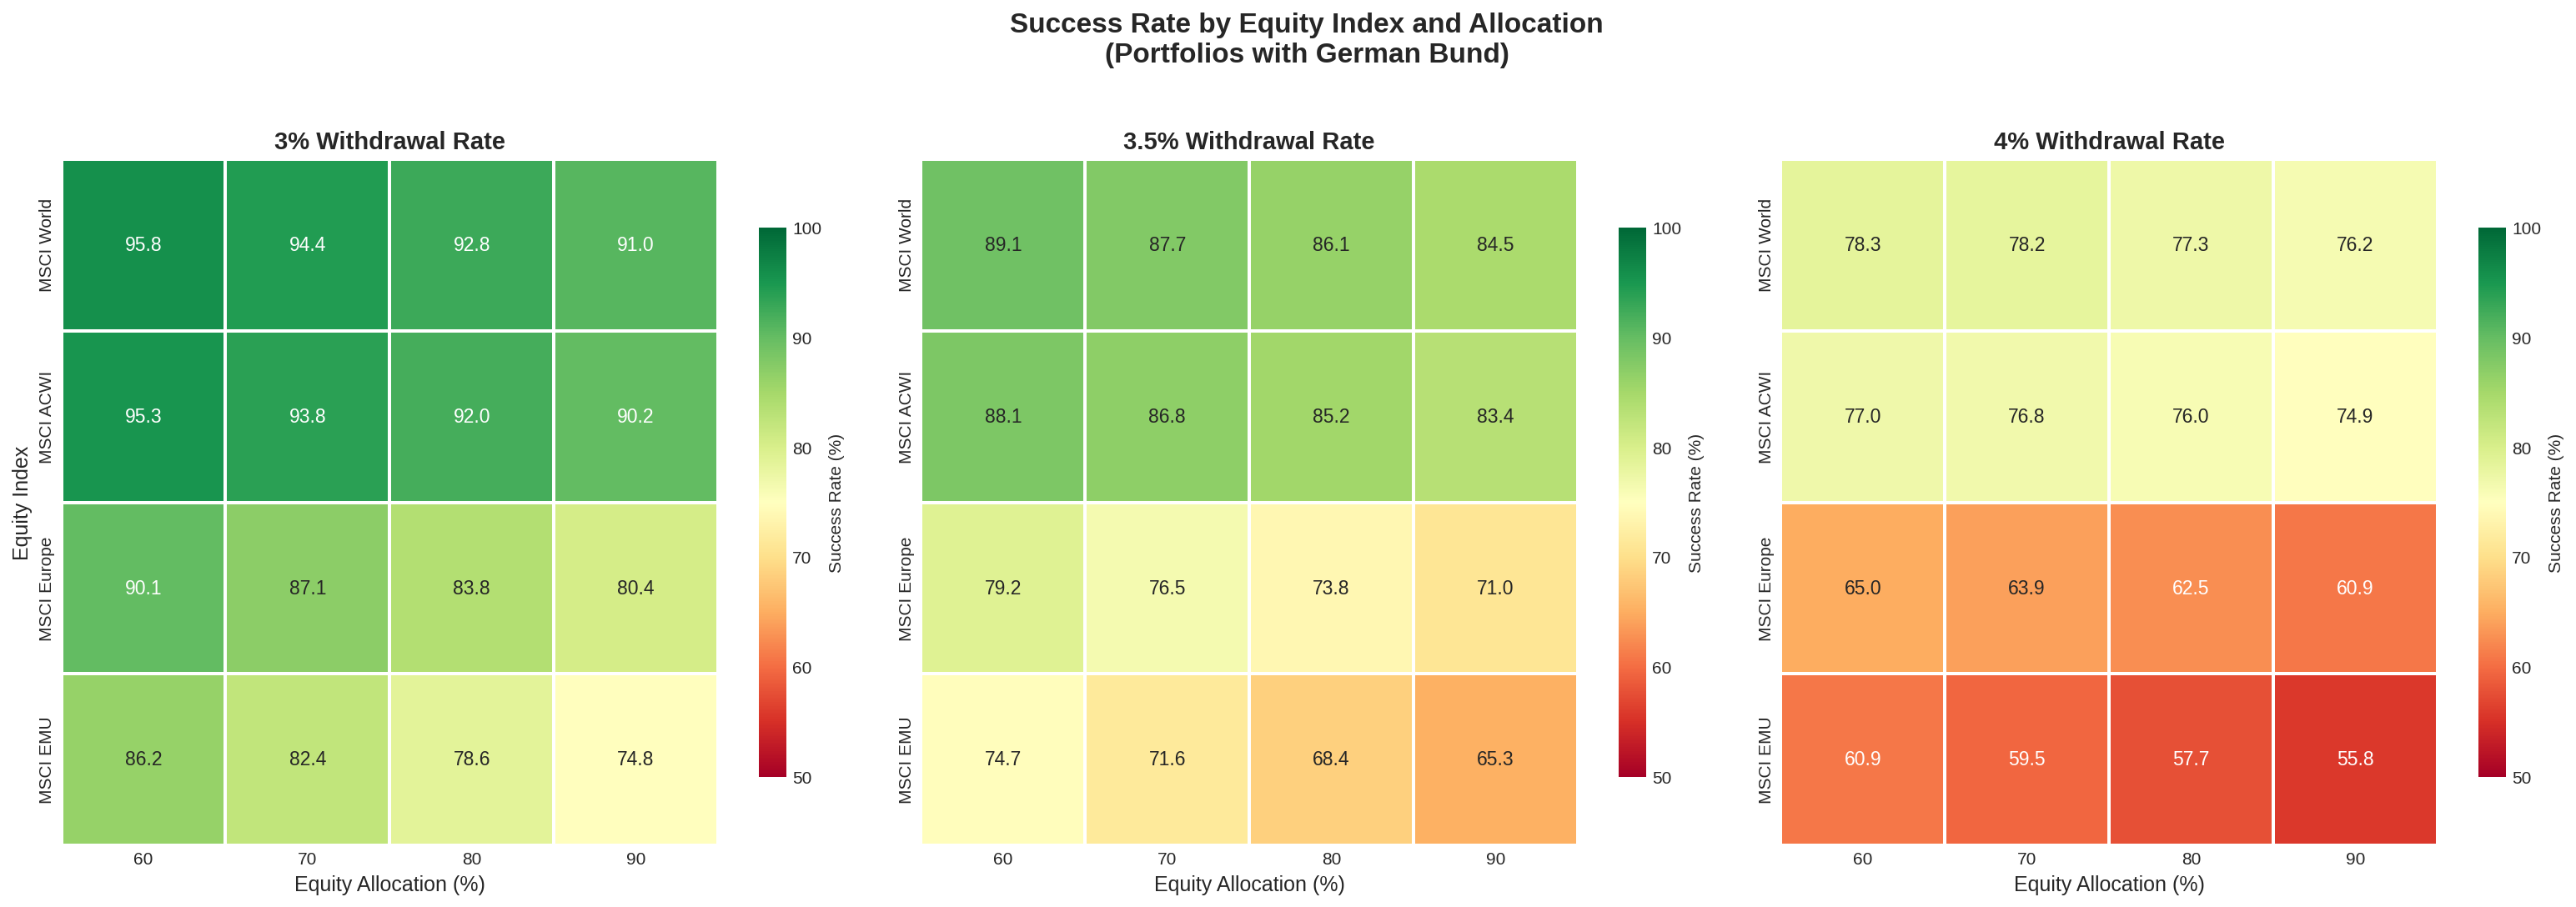
What withdrawal rate is safe for Europeans?
Only with a 3% withdrawal rate and a globally diversified portfolio does the success rate exceed 95%:
| Index | WR 3.0% | WR 3.5% | WR 4.0% |
|---|---|---|---|
| MSCI World | 95.82% | 89.08% | 78.35% |
| MSCI ACWI | 95.30% | 88.10% | 76.97% |
| MSCI Europe | 90.13% | 79.16% | 65.00% |
| MSCI EMU | 86.20% | 74.67% | 60.88% |
Purely European indices never reach 95%, even at 3%: MSCI Europe stops at 90.13% and MSCI EMU at 86.20%.
A 3.5% withdrawal rate represents a reasonable compromise for global portfolios, with approximately 89% probability of success.
What this means for your FIRE number
The choice of withdrawal rate has a dramatic impact on how much capital you need to accumulate:
| Annual expenses | WR 3% | WR 3.5% | WR 4% |
|---|---|---|---|
| 20,000 EUR | 666,667 EUR | 571,429 EUR | 500,000 EUR |
| 30,000 EUR | 1,000,000 EUR | 857,143 EUR | 750,000 EUR |
| 40,000 EUR | 1,333,333 EUR | 1,142,857 EUR | 1,000,000 EUR |
For an investor with 30,000 EUR annual expenses, choosing a safe 3% rate over the traditional 4% means accumulating 1,000,000 EUR instead of 750,000 EUR – a 250,000 EUR “safety premium” that buys you a jump from ~80% to ~96% probability of success.
Geographic diversification is fundamental
One of the most striking findings concerns the impact of home bias – the tendency of investors to overweight their domestic market.
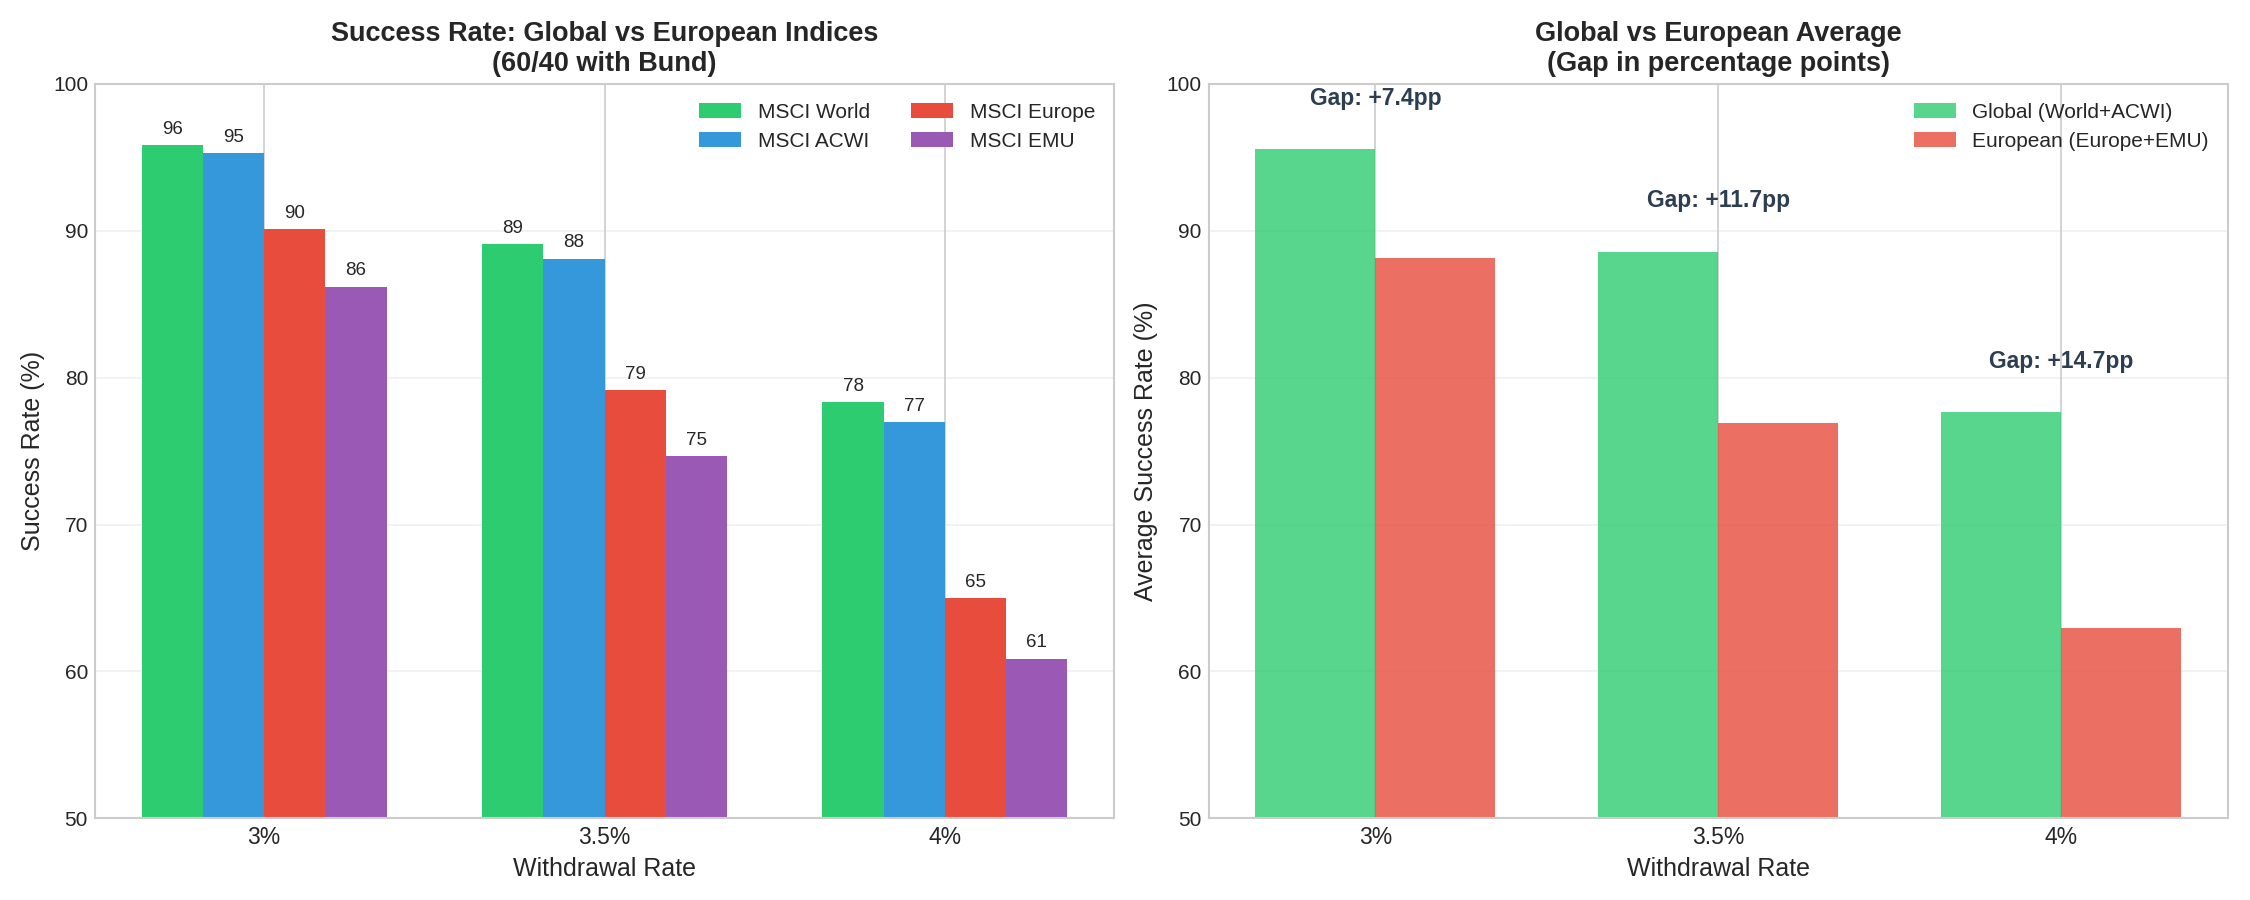
The gap between global and European portfolios is consistent at all withdrawal rate levels:
- +7.4 percentage points at 3% WR
- +11.7 percentage points at 3.5% WR
- +14.7 percentage points at 4% WR
Investing exclusively in the Eurozone (MSCI EMU) rather than globally (MSCI World) at a 4% withdrawal rate means the difference between a 78.35% and a 60.88% success rate – the probability of running out of money nearly doubles.
Asset allocation: 60/40 beats aggressive portfolios
Contrary to what one might expect, more aggressive allocations do not improve the success rate:
| Allocation | Success Rate | Final Median |
|---|---|---|
| 60/40 | 78.35% | 899,494 EUR |
| 70/30 | 78.17% | 1,097,975 EUR |
| 80/20 | 77.33% | 1,282,788 EUR |
| 90/10 | 76.23% | 1,444,403 EUR |
| 100/0 | 74.86% | 1,580,517 EUR |
The 60/40 portfolio achieves the highest success rate. While all-equity portfolios produce higher median final values, they have lower success rates due to greater volatility, which amplifies the sequence of returns risk – the risk that negative returns in the early years of retirement can irreversibly deplete the portfolio.
Bond choice: Bund vs BTP
A distinctive aspect of this analysis is the comparison between core (German Bund) and peripheral (Italian BTP) European government bonds.
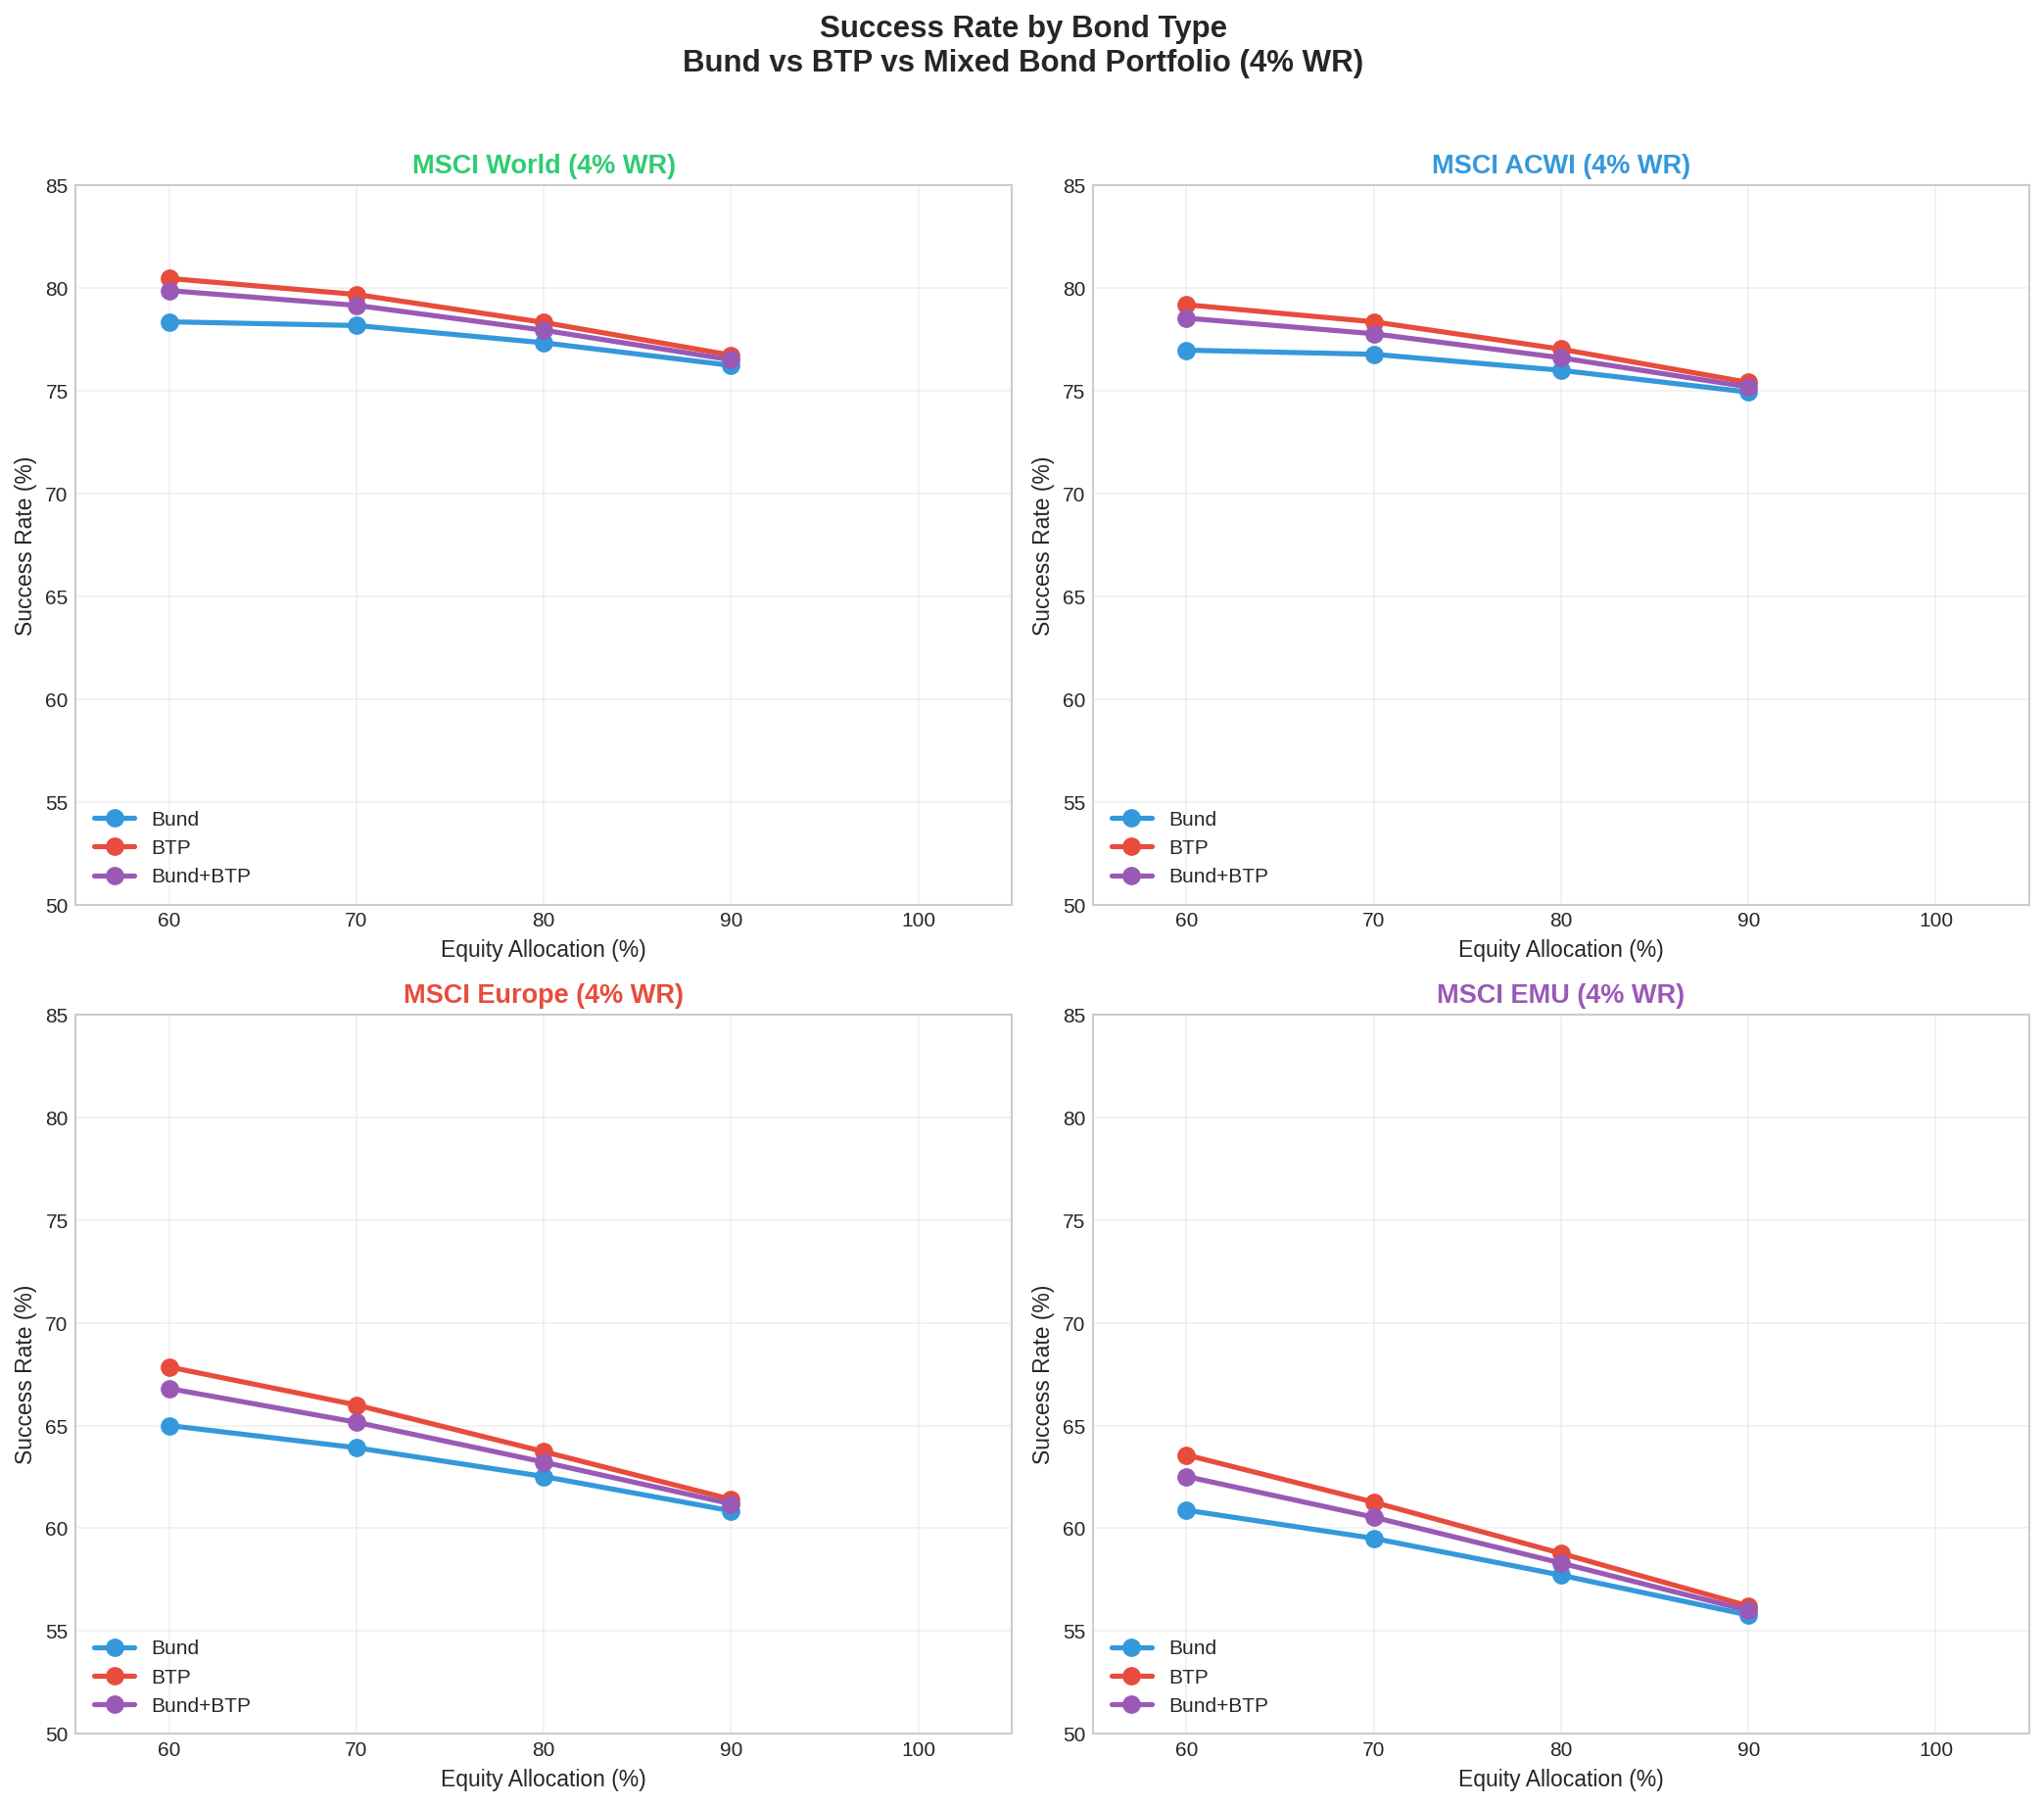
Surprisingly, Italian BTPs outperformed German Bunds over the 2000–2025 period, with a ~2 percentage point advantage in success rate and a 32% higher median final value. This is explained by the historically higher yields of BTPs, which more than compensated for the greater perceived credit risk.
However, this result is specific to the analysed period and may not hold in scenarios of Italian sovereign debt crisis. For this reason, a Bund/BTP mix appears preferable to diversify sovereign risk.
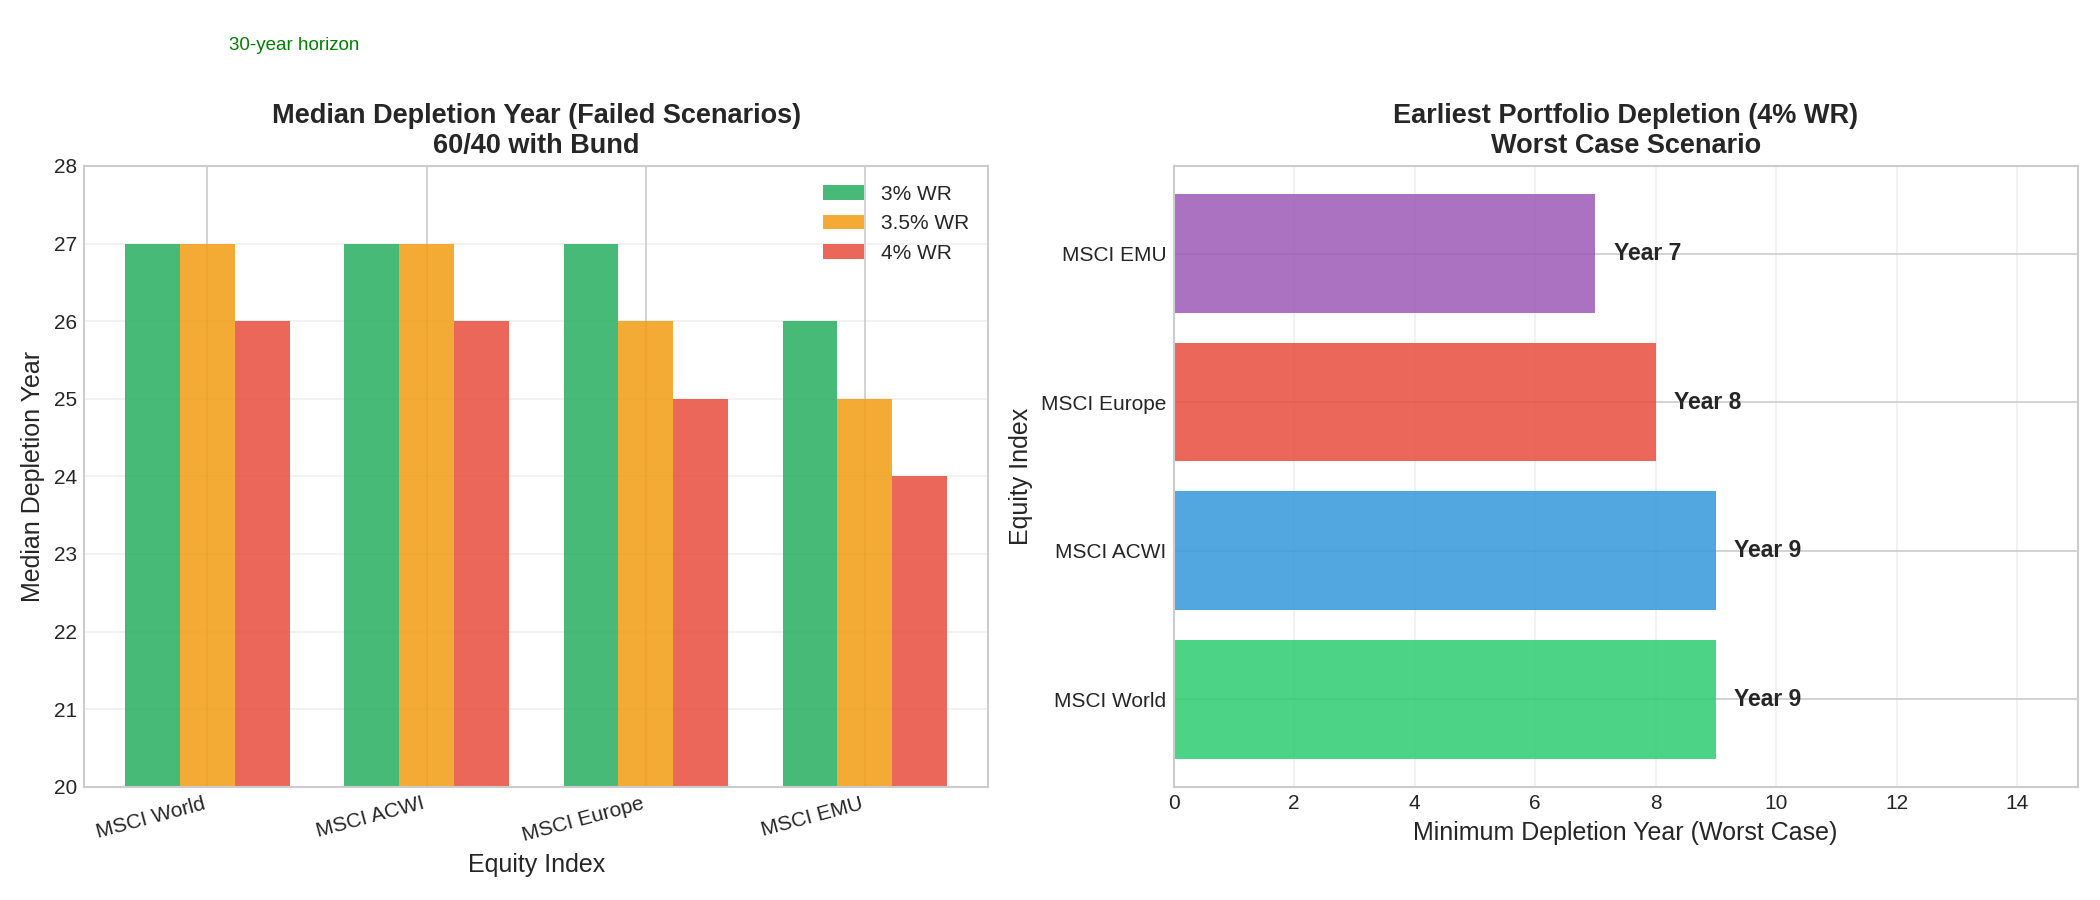
When do portfolios fail?
For portfolios that do fail, most failures occur in the final years of the 30-year horizon:
| WR | Median depletion | Earliest depletion |
|---|---|---|
| 3.0% | Year 27 | Year 14 |
| 3.5% | Year 27 | Year 13 |
| 4.0% | Year 26 | Year 12 |
However, in the worst cases, portfolios can be depleted after just 12 years, highlighting the importance of the sequence of returns risk.
Risk-return trade-off
The scatter plot below illustrates the fundamental trade-off between safety and potential wealth:
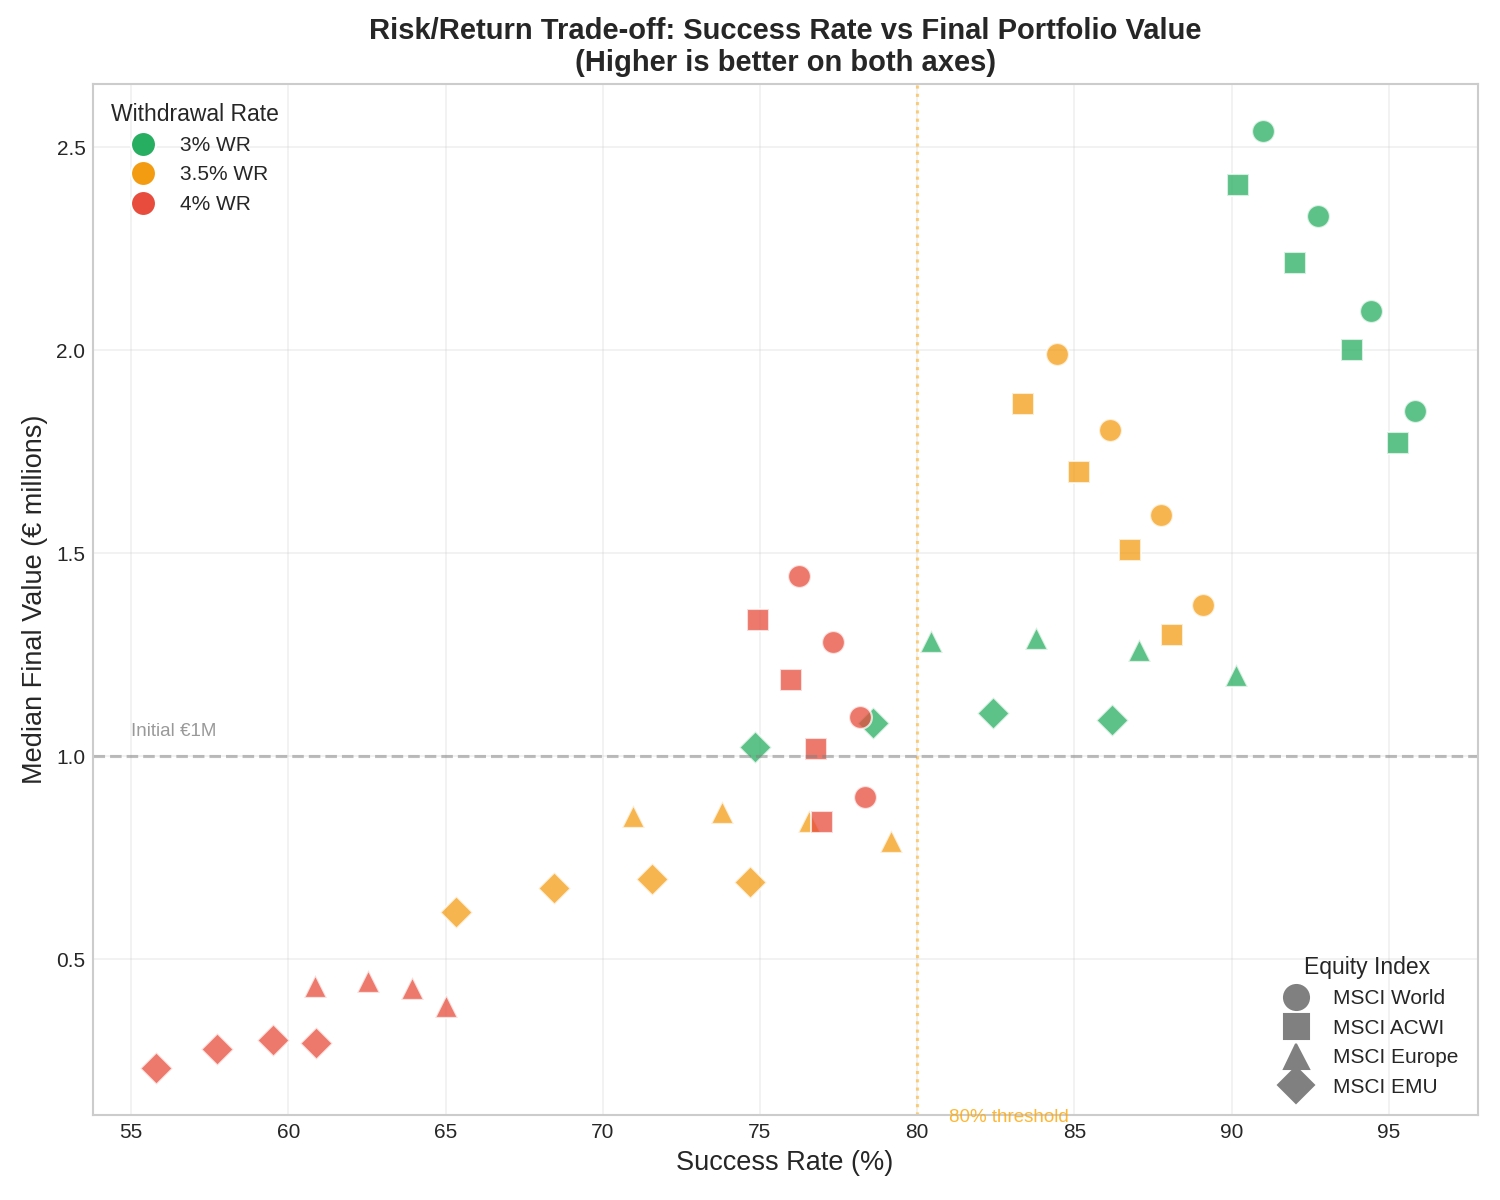
Summary and recommendations
Based on 16.1 million Monte Carlo simulations, here are the key takeaways for a European investor pursuing FIRE:
- The 4% rule is not safe in Europe: success rates range between 61% and 80%, far from the 95% US benchmark
- Use a 3–3.5% withdrawal rate: only a 3% rate with globally diversified portfolios exceeds the 95% safety threshold; 3.5% offers a reasonable compromise at ~89%
- Diversify globally: avoid home bias – investing only in European markets reduces success rates by 13–17 percentage points
- Keep a balanced allocation: 60/40 or 70/30 equity/bonds is optimal; more aggressive allocations increase volatility without improving success rates
- Mix your bonds: a Bund/BTP combination helps diversify sovereign risk
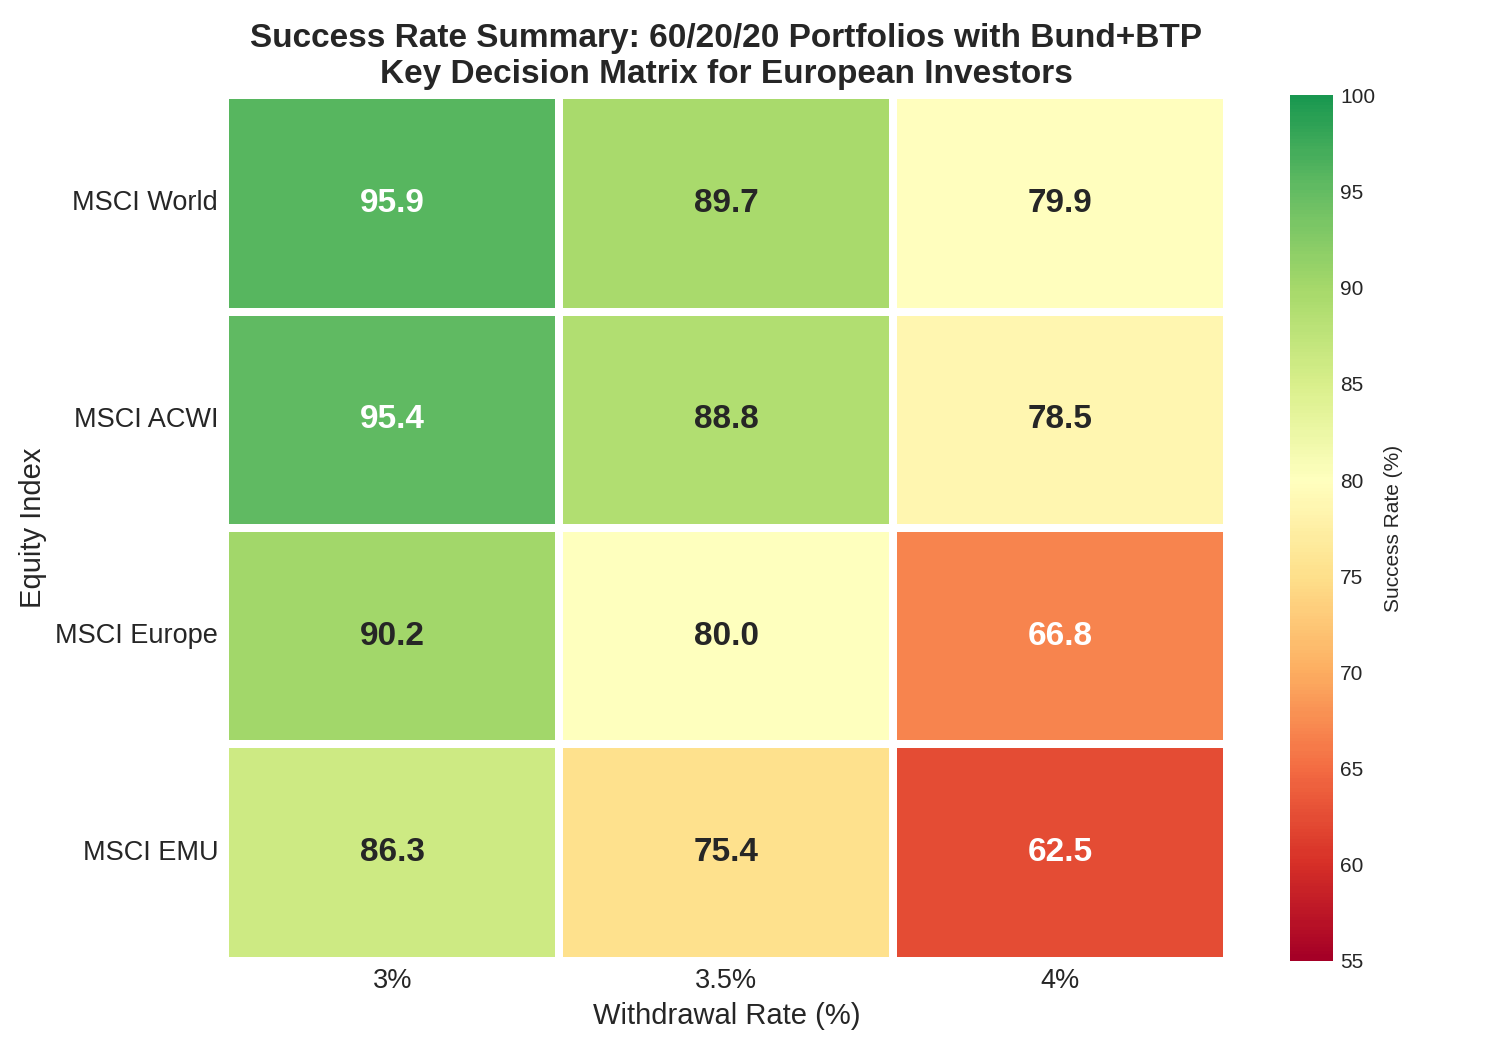
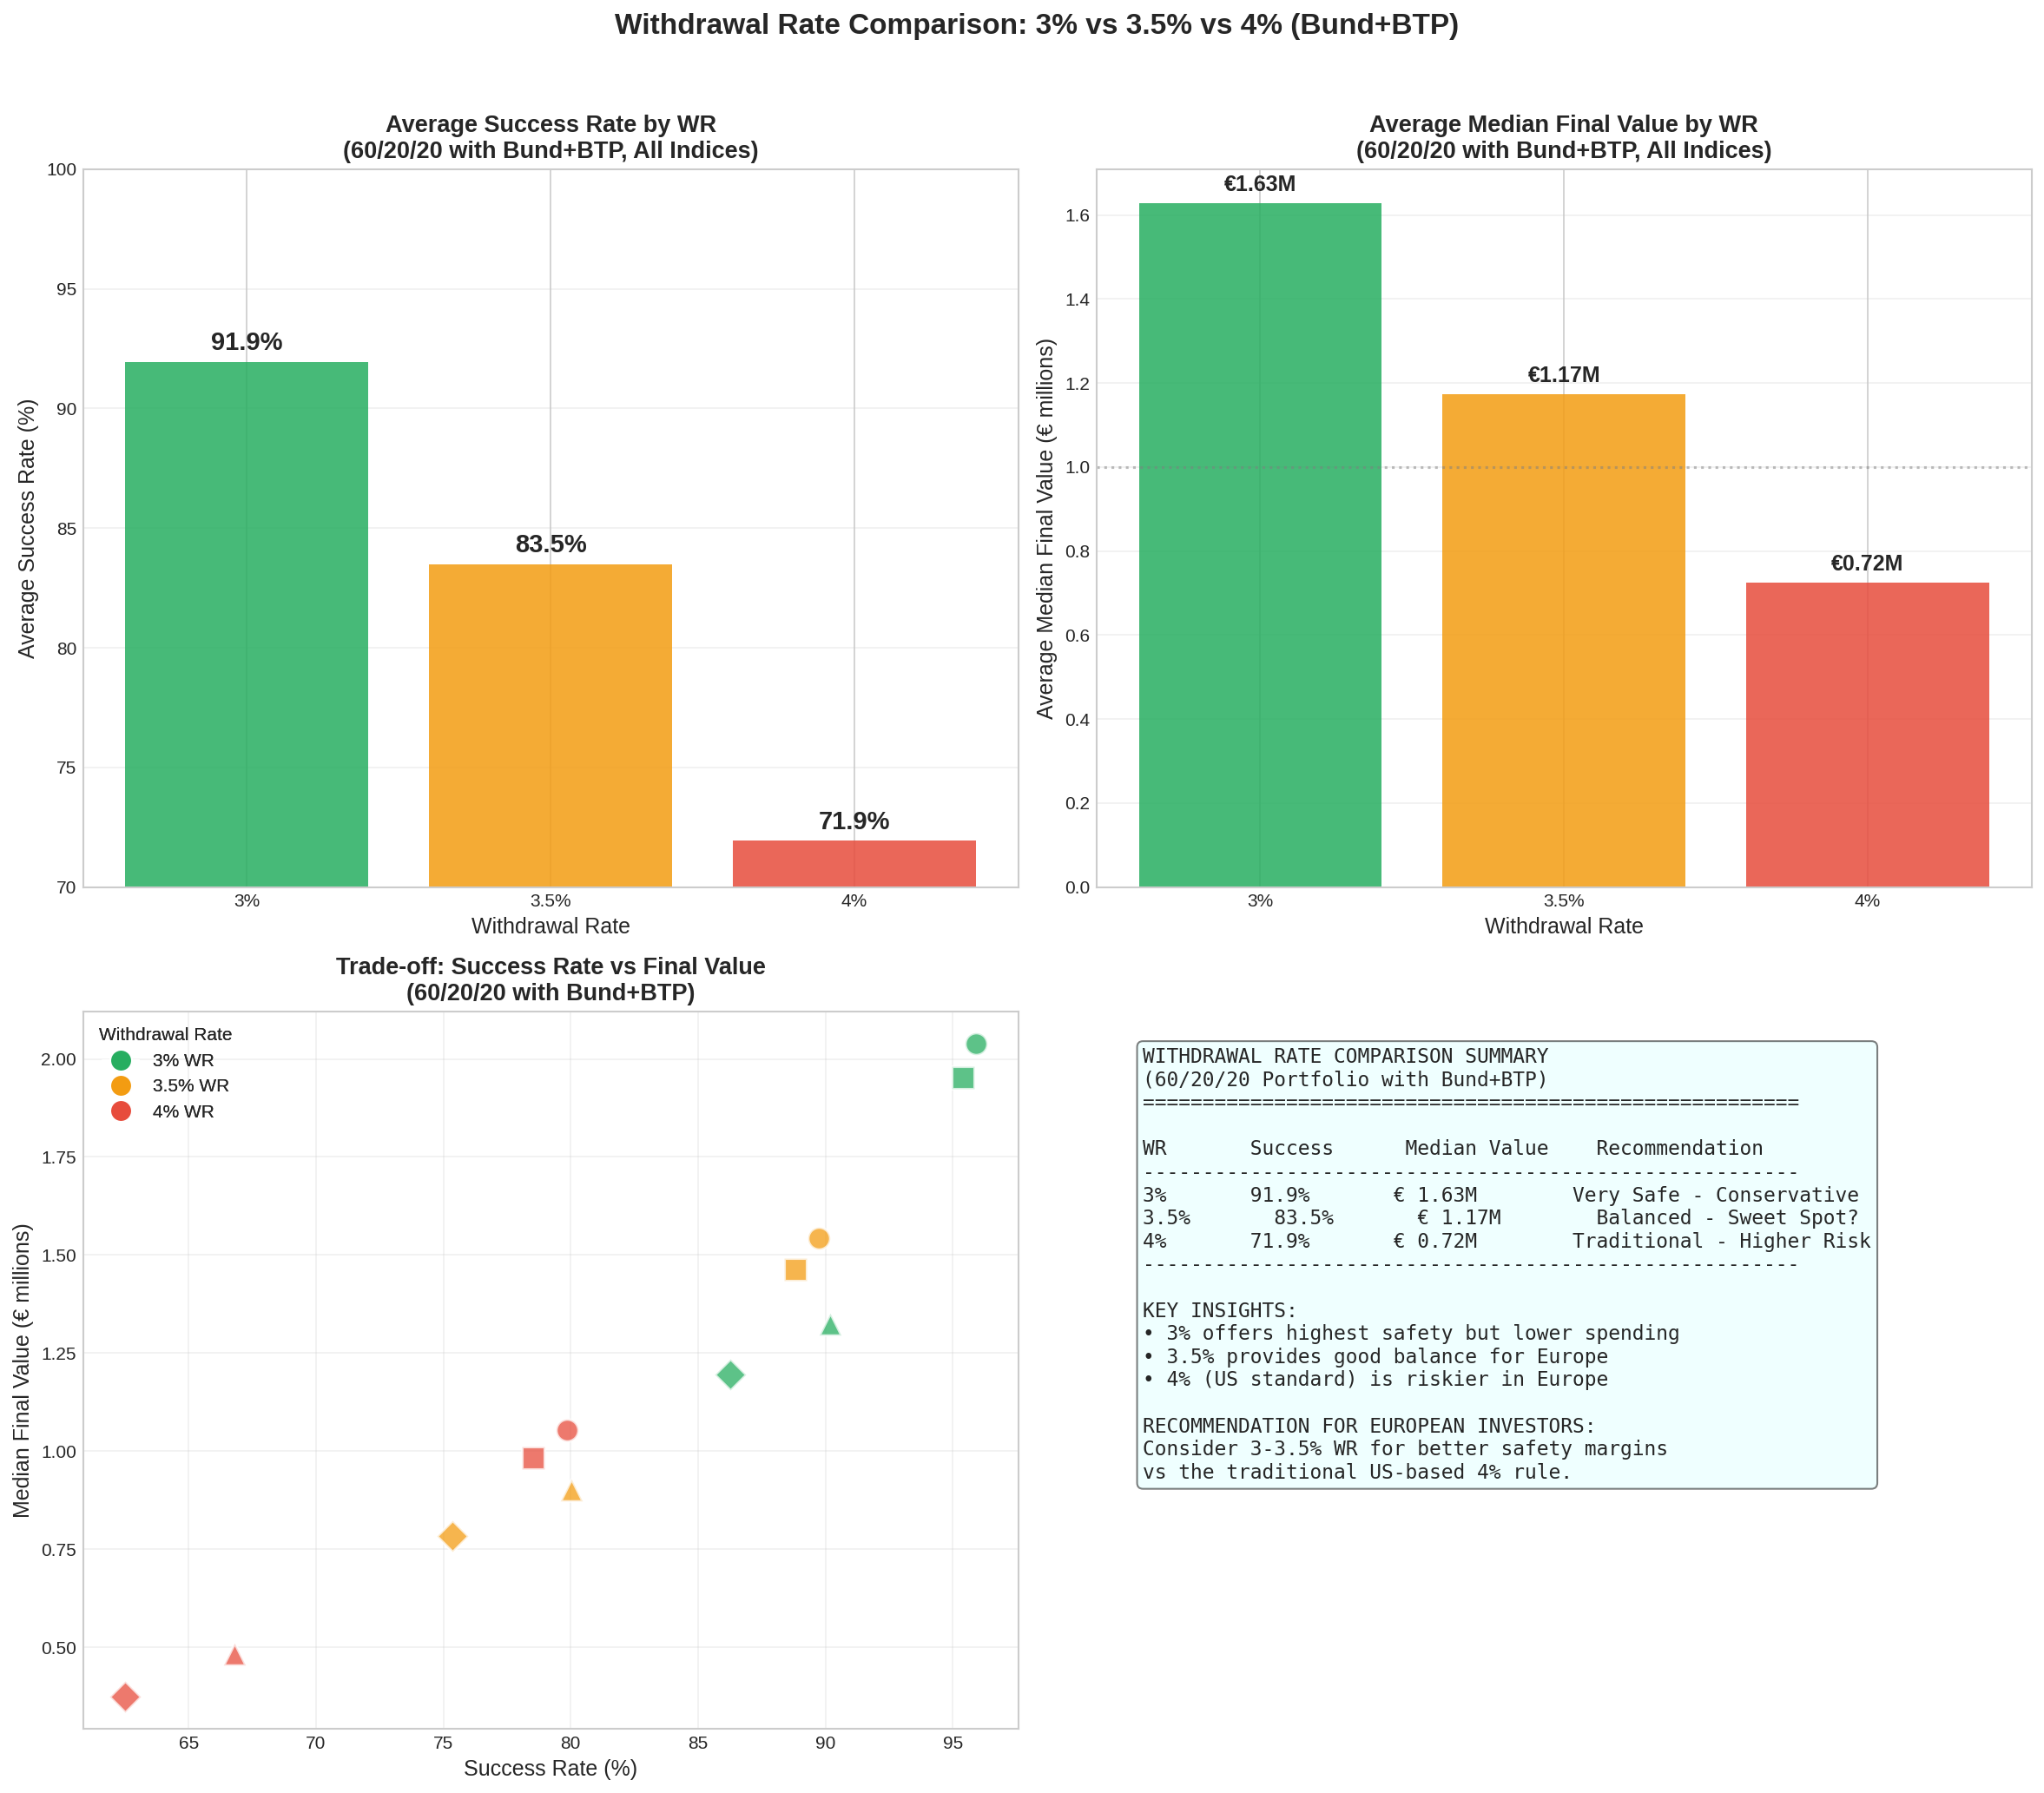
The optimal European FIRE portfolio
| Profile | Configuration | WR | Success Rate |
|---|---|---|---|
| Conservative | MSCI World + Bund/BTP Mix 60/20/20 | 3.0% | 95.91% |
| Moderate | MSCI World + Bund/BTP Mix 60/20/20 | 3.5% | 89.74% |
| Aggressive | MSCI World + Bund/BTP Mix 60/20/20 | 4.0% | 79.87% |
Limitations and disclaimer
This analysis has important limitations to keep in mind:
- Limited historical window: the 2000–2025 period (25 years) includes significant events (dot-com bubble, 2008 crisis, euro crisis, COVID-19) but may not be representative of all possible future scenarios
- No taxation: Italian financial income taxation (26% on capital gains, 12.5% on government bonds) is not considered, which would further reduce net returns and the sustainable withdrawal rate
- No transaction costs: trading commissions, bid-ask spreads, and fund management costs (TER) are not included
- Past performance: simulations based on historical data implicitly assume that the future will be statistically similar to the past
Important: the considerations in this article derive exclusively from the analysis of historical data and simulations. They do not constitute personalised financial advice. Every investment decision should be made with the support of a licensed financial adviser, based on one’s personal circumstances.